
What Are AI Dashboards and Why Do B2B Leaders Need Them?
AI dashboards are intelligent business intelligence interfaces that automatically aggregate, analyze, and visualize data from across an organization in real time. According to NVIDIA's 2026 enterprise analytics report, organizations using AI-powered dashboards achieve a 5-10% revenue uplift by making faster, data-driven decisions compared to those relying on traditional reporting tools.
How Do AI Dashboards Differ from Traditional Business Intelligence?
Traditional BI dashboards display historical data in static charts and require analysts to manually configure queries, build reports, and interpret results. AI dashboards fundamentally change this paradigm. They automatically identify trends, surface anomalies, predict future outcomes, and recommend actions, all without requiring users to know what questions to ask.
The difference is between a rearview mirror and a GPS. Traditional BI tells you what happened. AI dashboards tell you what is happening now, what will likely happen next, and what you should do about it. According to PwC's 2026 analytics benchmark, organizations using AI-powered analytics achieve a 40% improvement in decision-making speed, because leaders spend less time gathering and interpreting data and more time acting on insights.
"The most valuable thing an AI dashboard does is surface the questions you did not know to ask. Traditional dashboards answer predefined questions. AI dashboards discover patterns and anomalies that humans would never spot in millions of data points." — DJ Patil, Former U.S. Chief Data Scientist
What Capabilities Should a B2B AI Dashboard Have?
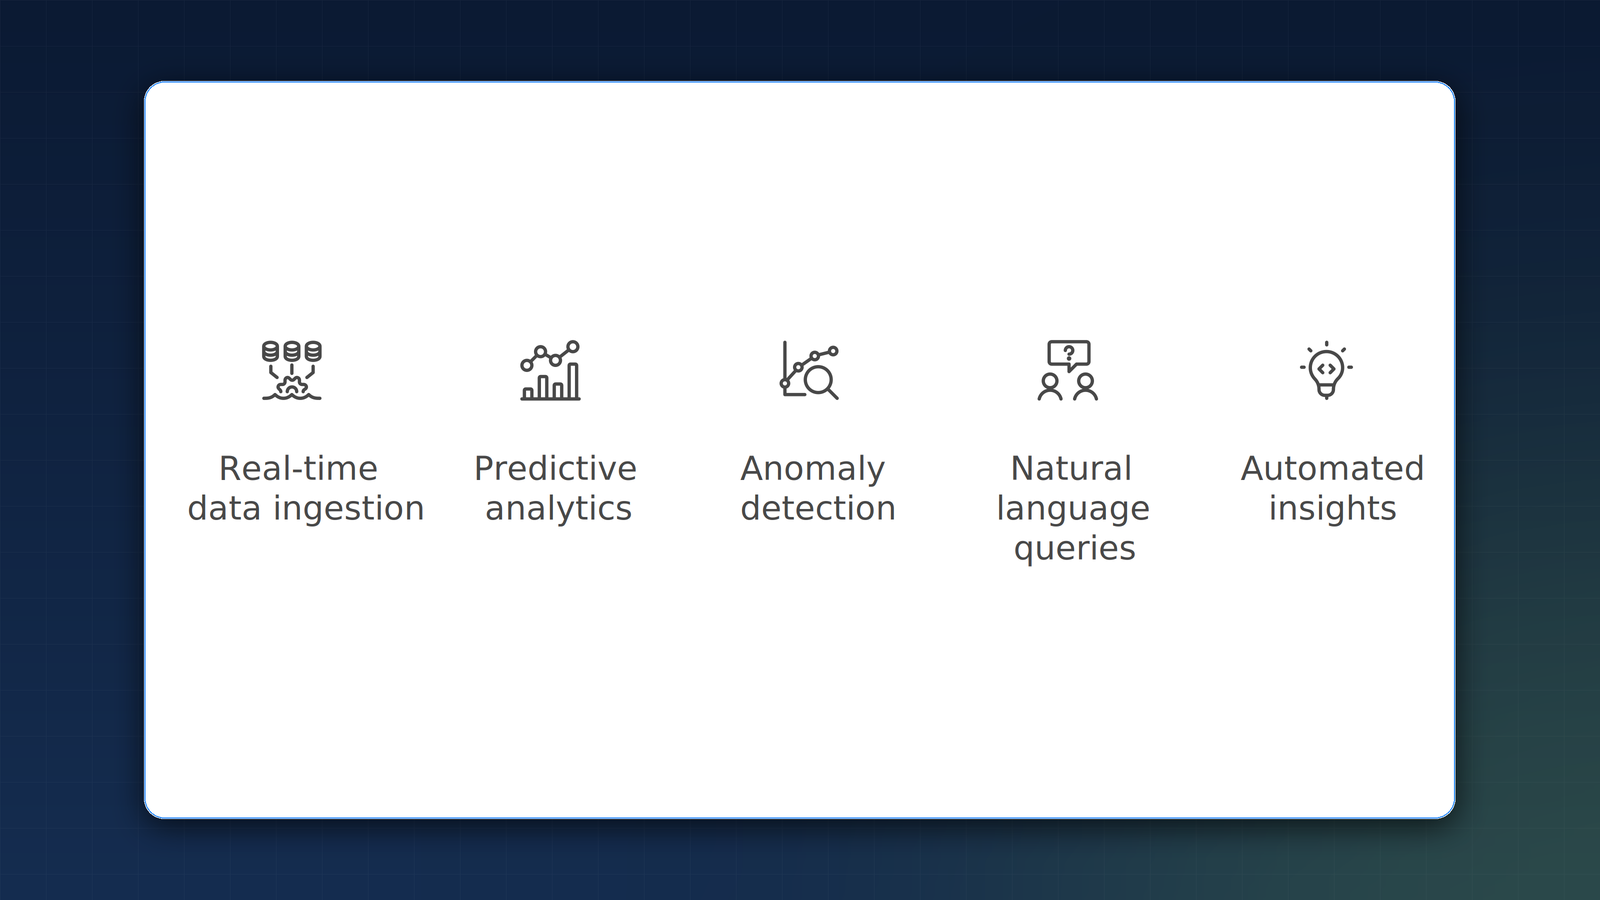
An effective AI dashboard for B2B organizations should go far beyond data visualization. The capabilities that separate AI dashboards from traditional tools include natural language querying, automated anomaly detection, predictive forecasting, and prescriptive recommendations. Here is what each capability delivers:
- Natural language queries: Ask questions in plain English instead of writing SQL. "What were our top-performing campaigns last quarter?" returns instant results.
- Anomaly detection: AI continuously monitors all data streams and alerts leaders to unusual patterns, such as a sudden drop in conversion rates or an unexpected spike in support tickets.
- Predictive forecasting: Machine learning models project future trends based on historical data and current conditions, enabling proactive rather than reactive management.
- Prescriptive recommendations: Beyond predicting what will happen, AI dashboards suggest specific actions to optimize outcomes.
Deloitte's 2026 analytics survey found that organizations deploying all four capabilities report 66% productivity gains in their analytics and reporting functions, freeing data teams to focus on strategic analysis rather than report generation.
How Are B2B Leaders Using AI Dashboards Today?
The use cases span every function in a B2B organization. Sales leaders use AI dashboards to monitor pipeline health, identify at-risk deals, and optimize resource allocation in real time. Finance teams use them for cash flow forecasting, expense anomaly detection, and real-time P&L visibility. Operations leaders monitor supply chain performance, equipment health, and workforce utilization.
"We went from monthly board reports that were two weeks stale by the time they were presented to real-time dashboards where every board member can see current performance on their phone. The quality of our strategic discussions improved dramatically." — Mary Barra, CEO, General Motors
According to IBM's 2026 enterprise analytics study, organizations with AI-powered executive dashboards achieve 3.7x ROI on their analytics investments. The return comes not from the dashboards themselves but from the better decisions they enable. When leaders can see real-time performance data and AI-generated predictions, they allocate resources more effectively, respond to problems faster, and identify opportunities that would otherwise be missed.
How Do You Implement AI Dashboards Effectively?
Implementation follows a clear sequence that prioritizes data quality, integration, and user adoption. First, audit your data sources and ensure data quality. AI dashboards are only as good as the data they consume. Second, integrate data from all relevant systems: CRM, ERP, marketing automation, financial systems, and operational tools. Third, configure AI models for your specific business context. Fourth, design the interface for your specific users and decision-making workflows.
The most common implementation mistake is focusing on technology before data quality. According to Goldman Sachs' 2026 data infrastructure analysis, poor data quality costs organizations 15-25% of their revenue potential from AI investments. Clean, consistent, well-structured data is the foundation upon which every AI capability is built. Without it, even the most sophisticated dashboard will produce misleading insights that erode rather than build confidence in data-driven decision-making.
At Stable Solutions, we begin every AI dashboard project with a data audit that ensures the foundation is solid before building the intelligence layer. This audit identifies gaps in data collection, inconsistencies across systems, and quality issues that would undermine AI-powered analytics. Once the data foundation is established, the intelligence layer can be deployed with confidence, and organizations begin seeing measurable returns within weeks rather than months. The data quality work also pays dividends beyond dashboards: clean, well-integrated data accelerates every subsequent AI initiative, from predictive analytics to process automation. Organizations interested in the broader AI strategy should also consider how dashboards fit within their department-wide AI implementation, as the data infrastructure built for dashboards often becomes the foundation that enables AI adoption across operations, finance, HR, and marketing.
Key Takeaways
- AI dashboards deliver 5-10% revenue uplift by enabling faster, data-driven decisions, per NVIDIA research.
- Unlike traditional BI tools, AI dashboards automatically detect anomalies, predict outcomes, and recommend actions.
- Four essential capabilities: natural language queries, anomaly detection, predictive forecasting, and prescriptive recommendations.
- Organizations with AI dashboards achieve 3.7x ROI on analytics investments through better decision-making, according to IBM.
- Successful implementation starts with data quality and integration before building the AI intelligence layer.
Frequently Asked Questions
How long does it take to implement an AI dashboard?
A focused AI dashboard for a single department can be implemented in 4-8 weeks. Enterprise-wide implementations with multiple data source integrations typically take 3-6 months. The timeline depends primarily on data quality and integration complexity. Organizations with clean, well-structured data and modern API-accessible systems can move faster, while those requiring significant data cleaning or legacy system integration should plan for the longer end of these timelines.
Do AI dashboards require a data science team to maintain?
Modern AI dashboard platforms are designed for business users, not data scientists. Natural language queries and automated anomaly detection eliminate the need for technical expertise in day-to-day use. However, initial setup and model tuning benefit from data engineering expertise. Once configured, business leaders and department managers can interact with dashboards directly, asking questions in plain English and receiving instant, AI-generated insights without needing to write SQL or understand data modeling.
What data sources can AI dashboards integrate with?
AI dashboards can integrate with virtually any data source including CRM systems, ERP platforms, marketing automation tools, financial systems, IoT devices, and custom databases. The key requirement is accessible, structured data with consistent quality. Most modern platforms offer pre-built connectors for popular business tools like Salesforce, HubSpot, QuickBooks, and Google Analytics, significantly reducing integration time and complexity for standard enterprise software stacks.
How do AI dashboards handle data security?
Enterprise AI dashboards implement role-based access controls, data encryption, audit logging, and compliance with regulations like GDPR and SOC 2. Data governance should be addressed as part of the implementation, following the guardrail frameworks outlined in our AI governance guide. Each user sees only the data their role permits, and all queries and access events are logged for compliance auditing and security monitoring purposes.
What ROI can we expect from AI dashboards?
According to IBM's 2026 enterprise analytics study, organizations achieve 3.7x average ROI on AI analytics investments. The return comes from faster decision-making, reduced analyst labor costs, early anomaly detection that prevents revenue loss, and predictive forecasting that enables proactive resource allocation. Organizations that combine AI dashboards with automated alerting see even higher returns because problems are identified and addressed before they escalate into costly operational disruptions.
Next Steps
Ready to transform your business data into real-time, actionable intelligence? Contact Stable Solutions to discuss an AI dashboard implementation tailored to your organization. Our team will assess your data infrastructure, identify the highest-impact use cases, and deliver a dashboard that gives you the visibility you need to lead with confidence. Explore our full AI and automation capabilities.